Introductory Lab: Domino Size & Density
Background
● Background Overview
○ Measurements
Physical measurements are more than a simple numerical value. They are specified by:
A physical dimension which is a product of powers of base physical dimensions such as length, time, and mass. Other dimensions include, for example, electric charge.
A choice of units. Usually we use SI units: meter (m), second (s), and kilogram (kg).
A numerical value that depends on the choice of units.
A range of the numerical value depending on the accuracy of measurements.
Calculations performed using physical quantities follow certain rules:
Scalar physical quantities can be added or subtracted only if they have the same units.
Scalars can be multiplied (or divided). The same action must be performed on the values and on the units.
Volume and mass are two measures of the size of an object. If an object is made of a uniform material, then doubling the amount of material will double both its mass and its volume. Density is ratio of mass to volume.
Density is a material property, independent of the amount of material or shape of the object. The volume of a rectangular parallelepiped shape, i.e., a box, is the product length times width times height, i.e.:
○ Estimating Error
The accuracy of a measurement depends on the limits of the instrument, and on skill in using the instrument. One estimate of the accuracy of a measurement is to independently repeat the measurement multiple times and observe the range and standard deviation of the results. Another approach is to determine the instrument tolerance or precision.
Measurement errors change calculated or derived results in different ways, depending on how the quantities enter equations. For example, if the measured mass is larger than the actual mass, then the calculated density will also be larger that the actual density. Suppose, on-the-other-hand, that the measured volume is larger than the actual volume. Because the volume appears in the denominator of (1), the calculated density will be reduced.
Experimental Procedure
● Preview
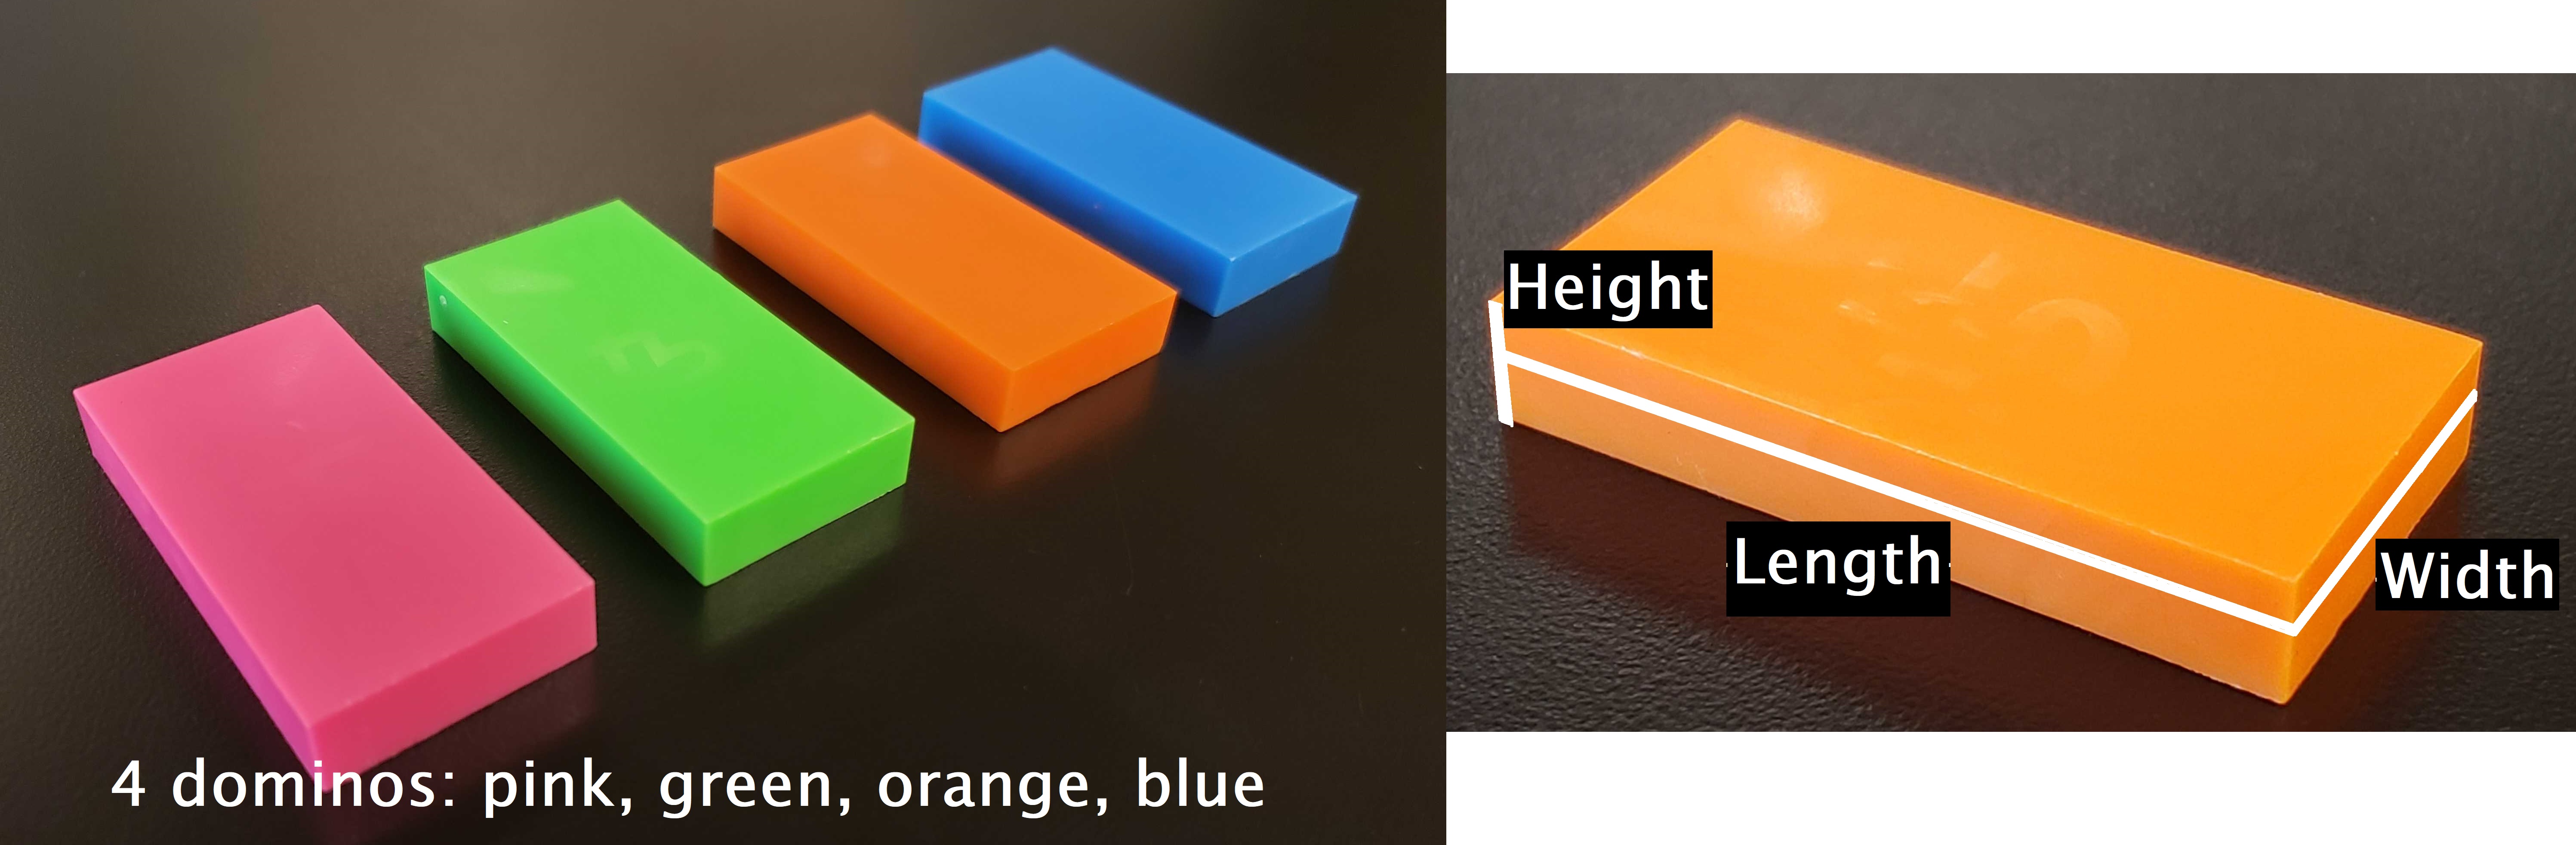
Figure 1:Left) Dominoes provided. Right) Relevant length, width, height dimensions of the dominoes.
Create data tables (See examples in ● Common Data and ● Trial Data):
Create a Common Data Table for values used in all the trials. In this case, include
the instrumental tolerance or precision of the triple-beam balance
the instrumental tolerance or precision of the Vernier caliper.
Create a Data Table with
Rows for each domino trial. A trial is the measurement by one lab group member of one domino color. For a group of two, there will be 8 trials; for a group of three, there will be 12 trials.
Columns for:
Trial number
Initials of the experimenter
Color of the domino
Measured length , width , height (see Figure 1) measured with Vernier calipers and mass measured with the triple-beam balance in the instruments’ units (e.g. mm, g, etc.)
, , , and converted to SI units
Calculated volume for the trial in SI units
Minimum volume and maximum volume (SI units)
Calculated density for the trial in SI units
Minimum density and maximum density (SI units)
Record the trial number, group member’s name or initials, and the domino color
Using the Vernier calipers (see Reading the Vernier scale), note the caliper’s measurement uncertainty in your common data table (smallest measureable increment, ). The Greek letter (said as “delta”) is representing the measurement uncertainty of each variable (e.g. ). Then measure and record, in the units of the calipers, the:
length
width
height
Using the triple-beam balance, note the balance’s measurement uncertainty (smallest measureable increment, ) in your common data table. Then measure & record the mass , in the units of the balance (e.g. grams).
Convert your measurements into SI units (e.g. kilogram kg, meter m, second s, etc.)
Calculate volume using (2), and density using (1).
You will now analyze your domino measurements in a few ways, through measurement uncertainties and through average and standard deviation (i.e. the spread of the data from the average).
In your data table, for each trial, calculate the minimized and maximized values for both and .
To minimize , minimize the values that go into that calculation (, , ) by the caliper’s measurement uncertainty in (2) which results in:
Maximize in a similar manner, now by maximizing , , .
In a similar way, minimize and maximize by using either or with minimized or maximized.
e.g. for , you would minimize the numerator and maximize the denominator such as:
At this point, you should have a complete trial with a range of densities based on your measurement uncertainties.
Does this range appear far from your estimated densities from the prior knowledge that these dominoes’ densities are close to that of water? If so, this is a good time to double check any of your measurements that may seem like an outlier or any of your calculations that may have been entered into Excel incorrectly.
Up to this point, each individual trial has its own range of densities based on the measurement uncertainties. If we were only analyzing individual trials, this can be satifactory for error analysis. However, each person measured each color domino. We can therefore also analyze the repeated measurements by looking at the average densities and the spread or variation of the data from that average value (i.e. standard deviation, often denoted as the Greek letter sigma, ).
We will analyze the data in two ways, first by sorting your data by domino color (across all group members) and by person (across all domino colors). To do so, create two Data Analysis tables including (● Analysis Table 1 (by color)):
Analysis Table 1 (by color):
Average and standard deviations of the length, width, height, mass, volume, and density of each color of domino.
Analysis Table 2 (by person):
Average and standard deviations of the length, width, height, mass, volume, and density of the color set measured by each lab group member.
Based on your data, do you expect some or all of the dominos to float, sink, or stay neutrally buoyant in room-temperature water? Before you leave, there should be a bucket of water near the front of the lab, test it out!
Post-Lab Submission --- Interpretation of Results
● Finalized Spreadsheets
Make sure to submit your finalized data table (Excel sheet).
● Post-lab Writeup
In a paragraph, summarize your error analysis. Be both qualitative and quantitative.
What was the precision of your equipment (calipers, triple-beam balance, etc.)?
What are possible systematic errors for today’s experiments?
How might your values of change based on those uncertainties?
How does the range of densities for an individual domino trial based on measurement uncertainties (i.e. and ) compare to the range of densities given by the standard deviation across colors or across group members?
Larger or smaller? IWhat does this comparison imply about the main sources of error in this experiment?
In a paragraph, summarize the results you have determined in each case. Consider:
What were your densities for each of the different colored dominoes (based on Analysis Table 1), and did each color agree (within experimental uncertainty assuming the use of standard deviation as our uncertainty)? In other words, do all the , , etc. agree?
Are the average densities of all four dominoes as measured by each person consistent (within experimental uncertainty assuming the use of standard deviation as our uncertainty)? (i.e. do all the , , etc. agree?)
Based on your measurements, did you expect the dominoes to float in water (at room temperature)? Did you test it? What did you find, confirmation or disconfirmation of your predictions?
The Whiteboard
Example data tables are shown below to assist you in building your spreadsheet for this first lab. Additionally the original whiteboard summary is at the end of this section.
● Common Data
| Variable (units) | Value |
|---|---|
| Mass uncertainty (SI units) | |
| Caliper uncertainty (SI units) |
● Trial Data
| Trial number | Group Member Initials | Color | Length (measurement units, mm) | Width (measurement units, mm) | Height (measurement units, mm) | Mass (measurement units, g) | Length (SI units) | Width (SI units) | Height (SI units) | Mass (SI units) | Volume (SI units) | Min Volume (SI units) | Max Volume (SI units) | Density (SI units) | Min Density (SI units) | Max Density (SI units) |
|---|---|---|---|---|---|---|---|---|---|---|---|---|---|---|---|---|
| 1 | AB | pink | ||||||||||||||
| 2 | AB | green | ||||||||||||||
| 3 | AB | orange | ||||||||||||||
| 4 | AB | blue | ||||||||||||||
| 5 | CD | pink | ||||||||||||||
| 6 | CD | green | ||||||||||||||
| 7 | CD | orange | ||||||||||||||
| 8 | CD | blue | ||||||||||||||
| 9 | EF | pink | ||||||||||||||
| 10 | EF | green | ||||||||||||||
| 11 | EF | orange | ||||||||||||||
| 12 | EF | blue |
● Analysis Table 1 (by color)
| Length (units) | Width (units) | Height (units) | Mass (units) | Volume (units) | Density (units) | Did it float? | |
|---|---|---|---|---|---|---|---|
| Avg pink | |||||||
| Avg green | |||||||
| Avg orange | |||||||
| Avg blue | |||||||
| Stdev pink | |||||||
| Stdev green | |||||||
| Stdev orange | |||||||
| Stdev blue |
● Analysis Table 2 (by person)
| Length (units) | Width (units) | Height (units) | Mass (units) | Volume (units) | Density (units) | |
|---|---|---|---|---|---|---|
| AB avg | ||||||
| AB stdev | ||||||
| CD avg | ||||||
| CD stdev | ||||||
| EF avg | ||||||
| EF stdev |
● Original Whiteboard Info
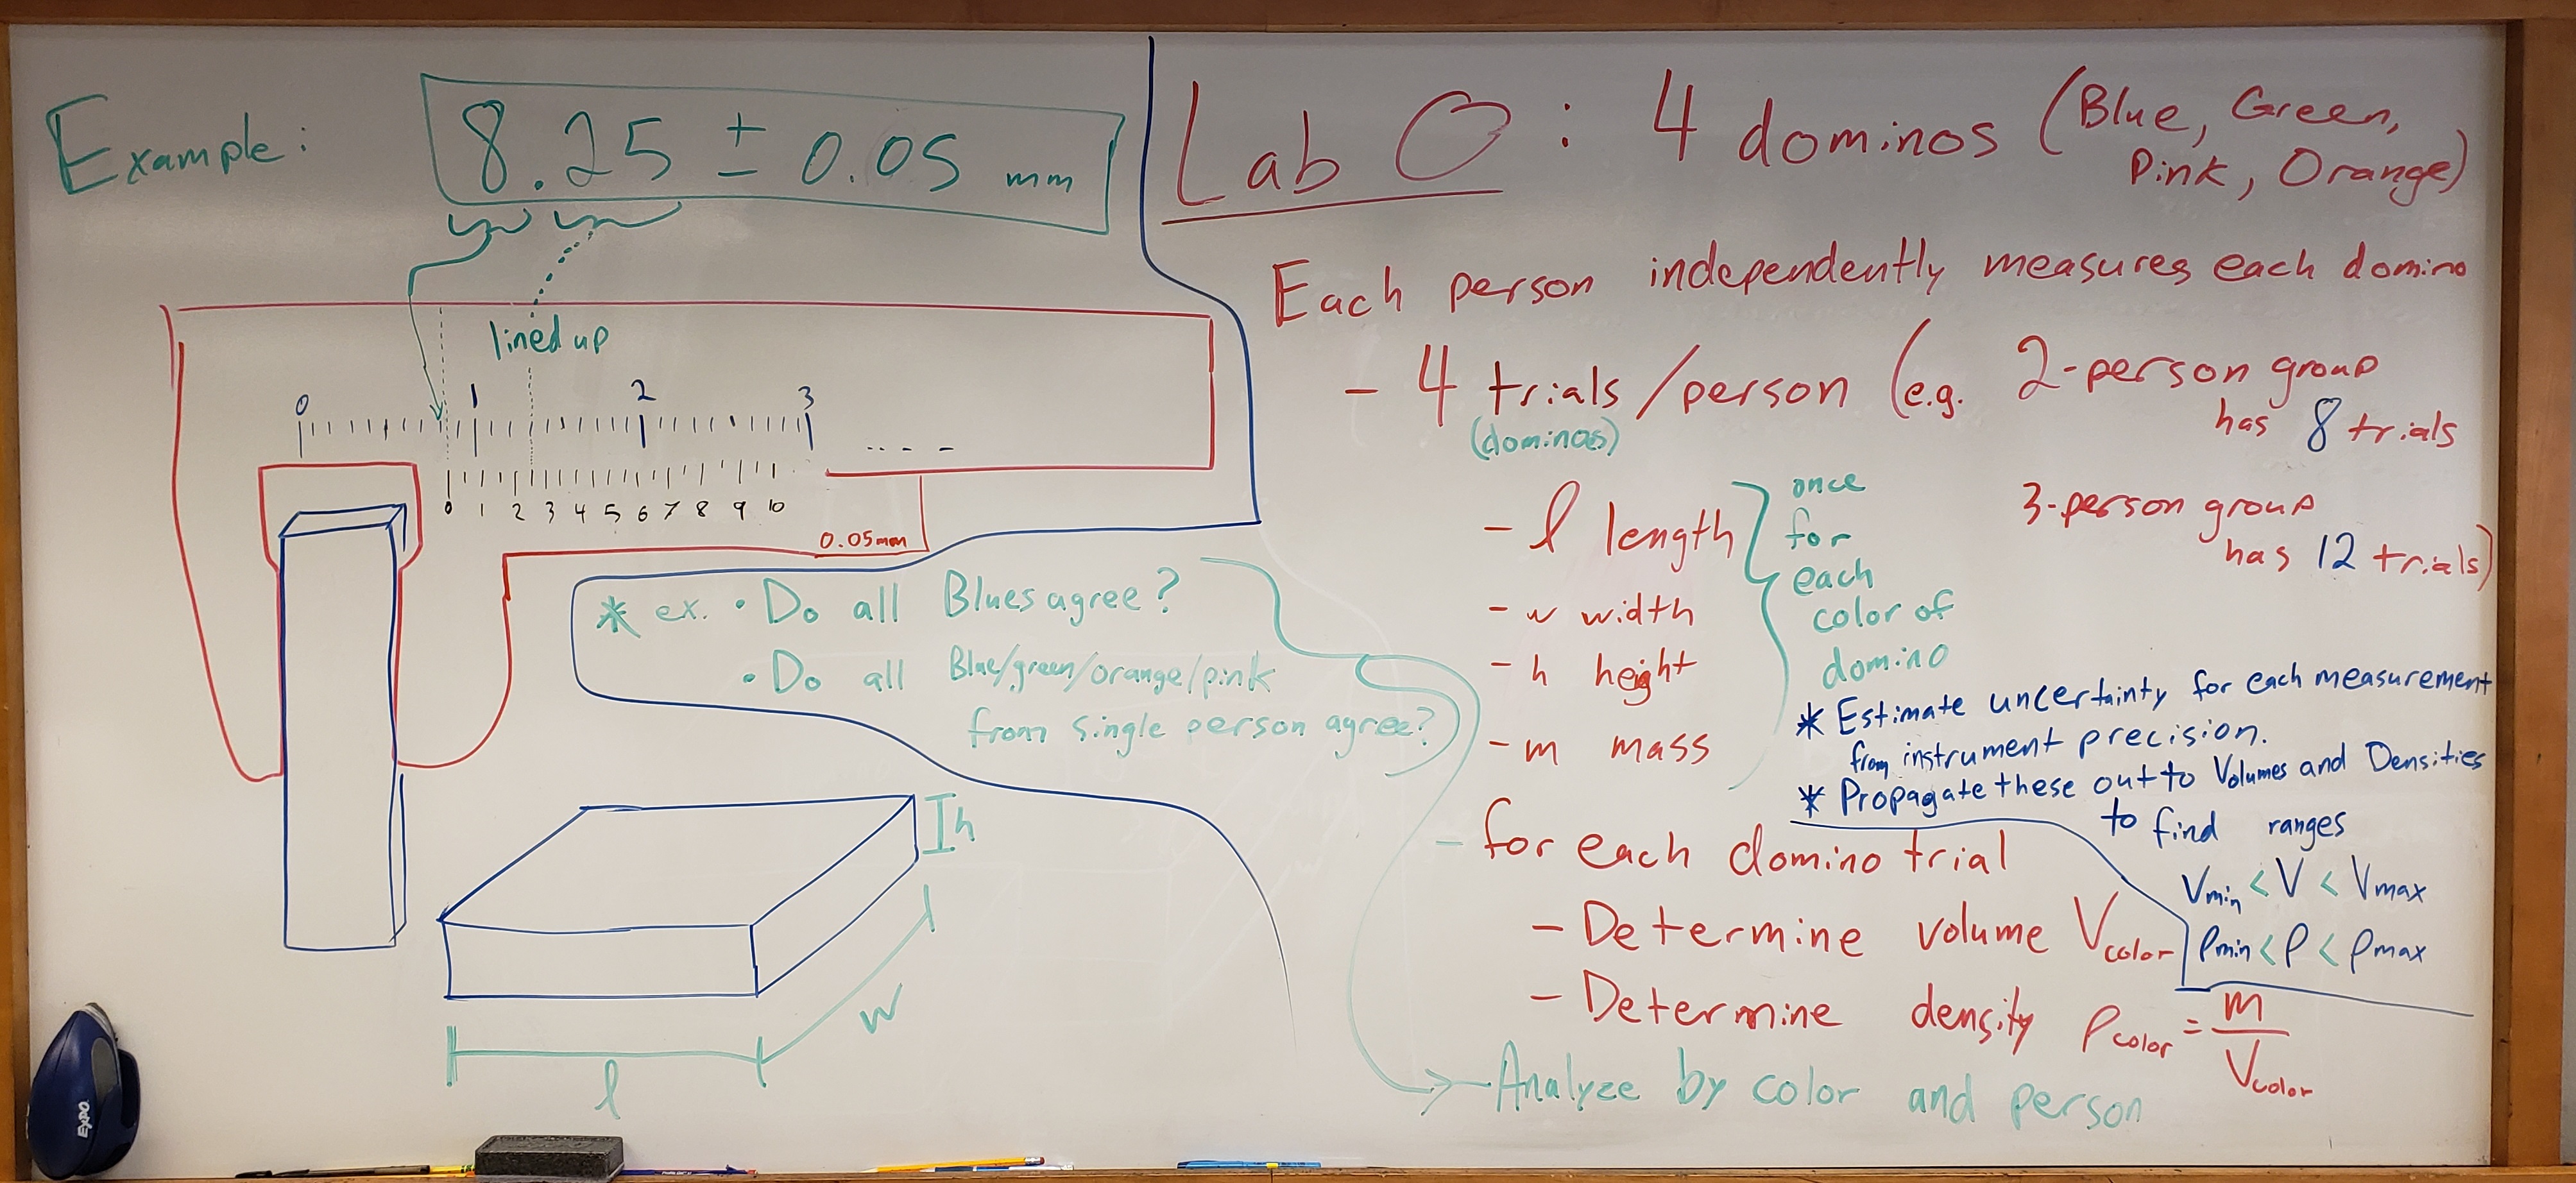
Figure 2:Original whiteboard summary